Section 5.1
Status of Mammals
Moose (Alces alces)
96.6% intact on average
The status of 12 mammals in the Al-Pac FMA area is, on average, 96.6% as measured by the Biodiversity Intactness Index.
Most of the large mammals that the ABMI monitors with cameras are habitat generalists and show relatively little response to scattered human footprint.
 Introduction
The Al-Pac FMA area is home to nearly 50 mammal species. The ABMI monitors mammals using remote cameras, which can only track the largest species. Some of these mammals play an important role in northern Alberta ecosystems by filling the role of top predators (e.g., Gray Wolf), while others are socially and economically important, providing hunting and trapping opportunities for Indigenous and local people.
Mammal populations in the Al-Pac FMA area have long been affected by hunting and trapping. More recent human activities, like forestry and energy development, are also affecting their populations[1]. Some species, like the Coyote and White-tailed Deer, benefit from many forms of human development, while other species become less common as human land-use intensifies[2]. Human activities that divide contiguous tracts of boreal forest into smaller patches impact species that require large undisturbed areas, such as Woodland Caribou.
Intactness and sector effects are summarized for mammals monitored using wildlife cameras in the Al-Pac FMA area and AEI.

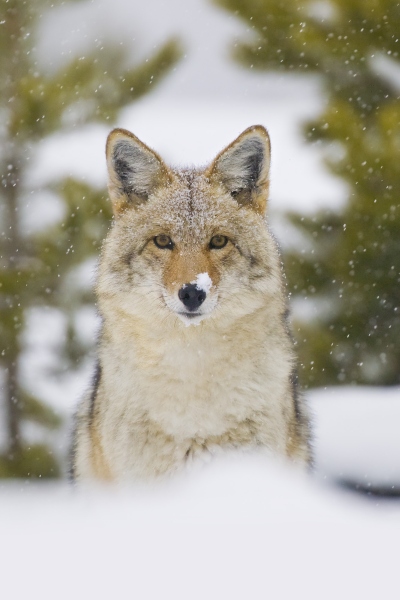
Coyote (Canis latrans)
Photo: Hal Brindley

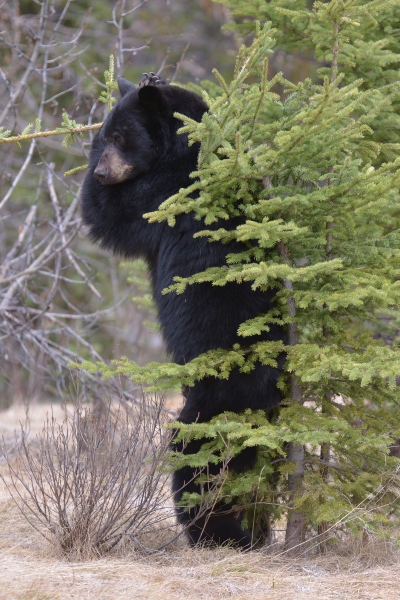
Black Bear (Ursus americanus)
Photo: Keith Murray
Principle 8: Monitoring and Assessment
Criterion 8.2 – Monitoring and evaluating environmental and social impacts of activities carried out in the management unit
FSC Indicator 8.2.3 (3) is supported by providing up-to-date ‘best available information’ on the status of naturally occurring native species from six taxa that can inform on the effectiveness of conservation and restoration actions taken within the FMA over time (linked to FSC Criterion 6.6).
 Results
Intactness of 12 mammal species was found to be, on average:
Highlights
- Intactness was within 5% of intact reference conditions for 11 of 12 mammals in the Al-Pac FMA area.
- The two species that deviated the most from intactness reference conditions were Red Fox (90.6% intact) and Wolverine (95.0%). Habitat suitability was higher than expected for Red Fox and lower than expected for Wolverine.
- Habitat suitability for all mammal species changed little between 2010 and 2016 as indicated by a small drop in intactness from 97.2% to 96.6%.
- Intactness of mammals was higher in the Al-Pac FMA area than in the AEI. This can mainly be attributed to the presence of agriculture footprint in the AEI, which creates favourable conditions for generalist species like Coyote (66.8%) and Red Fox (77.0%); these increaser species readily adapt to human-dominated landscapes and were more abundant than expected in the AEI. In contrast, agriculture footprint removes forested habitat for some species, such as Fisher (90.4%) and Marten (90.7%), reducing habitat suitability for these species in the AEI.

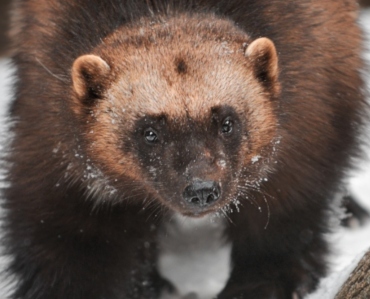
Wolverine (95.0% intact) prefers remote areas away from human development.
Photo: Geoffrey Kuchera
These results have benefited from collaboration between the ABMI and various partners and contributors. More details are available in Collaborators and Contributors.
 Sector Effects
Local-footprint Sector Effects
To understand which industrial sectors are most impacting mammal species in the Al-Pac FMA area, the local-footprint figures show how species’ relative abundance is predicted to change within each footprint compared to the habitat it replaced (Figure: Local-footprint Sector Effects).
- All sectors decrease habitat suitability for mammal species associated with mature/old forests, such as Marten and Fisher, because these activities impact their preferred habitat.
- Habitat generalist species, such as Coyote and Red Fox, are predicted to be more abundant than expected under most footprint types, especially agriculture and urban/industrial footprint.
- Mammal species are not as strongly impacted by forestry footprint compared to other footprint types.
Sector Effects on Regional Mammal Populations
The regional population figure shows the predicted change in the total relative abundance of mammal species across the Al-Pac FMA area due to each sector’s footprint (Figure: Regional Sector Effects).
- Regional effects are much less than local sector effects because a great deal of mammal habitat has not been disturbed by human footprint in the Al-Pac FMA area. In addition, mammals tend to be less impacted by industrial development compared to other taxonomic groups.
- For forestry, energy, transportation, and urban/industrial footprint, regional population effects of industrial sectors on mammal species ranged from –10.0% for Mule Deer to -4.6% for Red Fox.
- Forestry had the largest effects at the regional scale, mainly because this footprint type covers the largest area in the region.
To view species-specific sector effects, use the drop-down menu to select a species of interest.
References
Toews, M., F. Juanes. and A.C. Burton. 2018. Mammal responses to the human footprint vary across species and stressor. Journal of Environmental Management 217:690-699. doi.org/10.1016/j.jenvman.2018.04.009.
Fisher, J.T. and A.C. Burton. 2018. Wildlife winners and losers in an oil sands landscape. Frontiers in Ecology and the Environment 16(6):323-328. doi:10.1002/fee.1807

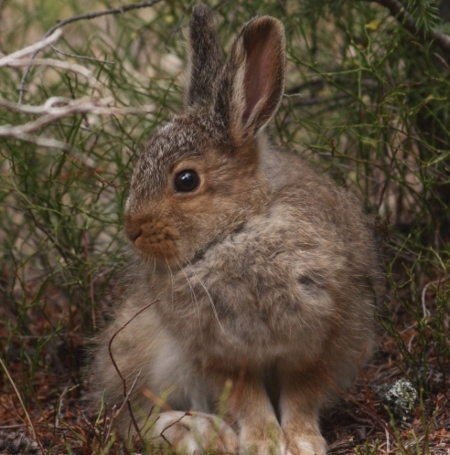
Snowshoe Hare
Photo: Andrew Hoffman


