Section 2.5
Research Spotlight: Spectral Regeneration of Harvested Areas
Spectral Regeneration is a method to assess the spectral recovery of harvest areas by measuring wavelengths of light reflecting from the ground surface.
Several metrics were used to assess the spectral recovery of harvest areas in the Al-Pac FMA area. Results indicate:
65%Average Spectral Regeneration
5-years after harvest
8 YearsTo Reach 80% Spectral Regeneration
on average
104%Average Spectral Regeneration
of current harvest areas
Introduction
Provincial-scale, up-to-date information on human footprint features of numerous types is currently available in the ABMI’s Human Footprint Inventory (HFI). However, the recovery of temporary successional footprints (e.g., harvest areas) that are reclaimed and/or regenerating post-disturbance are not differentiated from other more permanent footprints (e.g., roads or urban areas) in the HFI. In light of this, new research within the ABMI’s Geospatial Centre (GC) examines the use of satellite remote sensing-based information to monitor spectral regeneration (recovery) of temporarily disturbed or reclaimed areas.
Spectral regeneration is defined as the return of Earth surface spectral signals to pre-disturbance levels as measured by wavelengths of light reflecting from the ground surface. Different ground surfaces, such as young vegetation, old forest, or water, reflect different wavelengths of light. Differences in these wavelengths can be used to assess the degree of spectral regeneration; i.e., the return and growth of vegetation. Information reflecting changes in vegetation—the effects of succession, reclamation, etc. on human footprint features overtime—could add considerable value to the HFI data set.
For example:
- information on spectral regeneration could allow for the exclusion of footprint features judged to be fully recovered;
- regional patterns in spectral regeneration trends and status could also be examined and better understood;
- footprints showing unusual spectral regeneration trajectories could be pinpointed and flagged.
The ABMI is developing a scientifically-sound methodology for extracting remotely-sensed spectral regeneration trends focusing on harvest area footprints. The generally large size of these footprints, combined with the often distinct spectral signature accompanying timber harvest in remotely-sensed imagery, renders them an ideal starting point. Here we present preliminary results for harvest areas within Al-Pac’s FMA area.
This work is led by Jennifer Hird and the University of Calgary's Applied Geospatial Research Group. More details are available in Collaborators and Contributors.
The methods developed by the ABMI GC employ a series of satellite images, taken of the Earth’s surface by several of the Landsat sensors over several decades. These are used to evaluate general post-harvest vegetation regeneration by examining changes in the ground surface reflectance of harvest areas over time. Time series of a spectral vegetation index (SVI) – the combination of reflectance information from two or more wavelengths (spectral bands) into an index designed specifically to respond to changes in vegetation – are used to extract general trends in surface vegetation on a per-pixel basis. The SVI used by the ABMI, calculated with Equation (1), is an index that has been shown in published research to work well for examining forest vegetation disturbances and regeneration.
This SVI decreases as vegetation thins or declines in health, and drops sharply when vegetation is cleared. It increases as vegetation begins to re-establish and regenerates, returning to pre-disturbance levels over time.
In this equation NIR is near infrared, while SWIR is shortwave infrared, and values range from -1 to 1, though are often scaled up by 1000.
A number of metrics related to the spectral regeneration of harvest areas were extracted. It is important to acknowledge that these spectral signals are not a direct measurement of specific, on-the-ground vegetation characteristics or ecosystem functioning. Rather, they are an indicator signaling changes in surface vegetation. Per-pixel harvest- and post-harvest regeneration-related metrics extracted from the temporal trends in SVI time series include (Figure 1):
- Five-Year Spectral Regeneration: percent spectral regeneration (i.e., percent of pre-harvest spectral values that has been regained) at five years post-harvest, or in this case, five years from the start of spectral regeneration
- Years to 80% Regenerated: the number of years it requires for a harvest area to reach 80% of its pre-harvest spectral signal
- Current Spectral Regeneration Level (circa 2017): current level of spectral regeneration, as a percentage of the total drop in the SVI at the detected harvest
Results
Click on a topic to find out more about the results.
- Harvest Areas Analyzed
- Detected Year of Harvest
- 5-Year Post-Harvest Per Cent Spectral Regeneration
- Years to Reach 80% Spectral Regeneration
- Current Levels of Regeneration
Harvest Areas Analyzed
Overall, a total of 27,759 ABMI HFI (2017 version) harvest area polygons fall within the Al-Pac FMA area. Polygons were removed that were either:
- too small for reliable analysis,
- represented in the analysis by less than 50% of the Landsat image pixels they cover, and/or
- showed a total confidence score more than three standard deviations below the mean (< 24).
The above metrics were extracted for a final set of 9,516 harvest area polygons within the Al-Pac FMA area that were included in the spectral regeneration analysis (Figure: Harvest Areas Analyzed).
Of the 9,516 harvest areas, the majority were analyzed using > 80% of their pixel information (Figure: Proportion of Appropriate Pixels) and generated good total confidence scores (Figure: Confidence Scores).
Importance of the Dataset
The ABMI GC’s 2017 HFI harvest area spectral regeneration dataset offers a meaningful enhancement to the traditional HFI data provided by the ABMI, which treats temporary successional footprint and permanent features equally. This new dataset offers a means to start addressing the lack of dynamic representation in the HFI datasets for temporary successional footprints, such as harvest areas.
There are a number of potential applications for these data:
- It could be possible to identify footprint types that, according to their spectral properties, have regenerated to spectrally match pre-disturbance conditions and could therefore be removed from human footprint representations of the Alberta landscape. However, it must be noted that recovery based on spectral regeneration criteria is likely not equivalent to recovery based on other criteria, such as species assemblages found in mature/old forests.
- Variations in rates or levels of spectral regeneration of particular footprint types could be examined at regional or provincial scales to understand what factors (e.g., topographical, climatic, ecological) might be identifiable as drivers and/or limiting factors for spectrally-based regeneration. This information could then be useful for informing future resource management approaches, policy-making, or current understandings of cumulative effects on the Albertan landscape.
- These data could be used to test, augment, and/or improve current regeneration models used at local scales.
The intent of the ABMI’s harvest area spectral regeneration dataset is to offer users a value-neutral, remote sensing-based view of post-harvest regeneration on relevant harvest areas across Alberta. This is a unique, provincial-scale dataset with the potential to offer new insights and opportunities for understanding broad patterns in post-harvest spectral regeneration.
Next Steps
Further research and development of the spectral regeneration dataset will focus on:
- adding the spectral regeneration dataset to the ABMI’s collection of publicly available human footprint information products;
- exploring and pursuing opportunities for the comparison, calibration, and validation of these spectral data with various types of ground-based field observations, and;
- expansion and application of the developed workflow to other types of human footprint features, such as well pads and mines within the HFI.
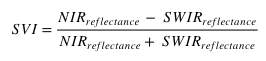
Harvested understory
Photo: Al-Pac
References
Government of Alberta.2012. Lower Athabasca Regional Plan. Available at: www.landuse.alberta.ca.
Alberta Pacific Forest Industries. 2012. Forest Stewardship Report Overview: Reporting Period 2006–2010. Available at: https://alpac.ca/application/files/3014/1876/0531/Overview_-_2011_Al-Pac_Forest_Stewardship_Report_v5_4_bb_-_dds_September_2012.pdf.
Anonymous. 2018. Introduction to the Ecological Land Classification (ELC) 2017. Statistics Canada. Ottawa, ON. https://www.statcan.gc.ca/eng/subjects/standard/environment/elc/2017-1.
DUC, CPAWS, Al-Pac, Mistik. 2018. Protected Areas Gap Analysis – Phase 1 Report, North East Alberta & North West Saskatchewan. 46 pp. Internal Report.
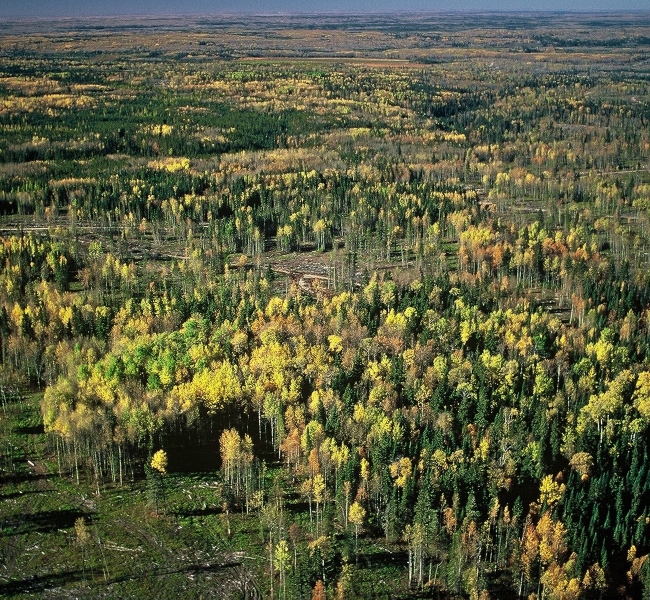
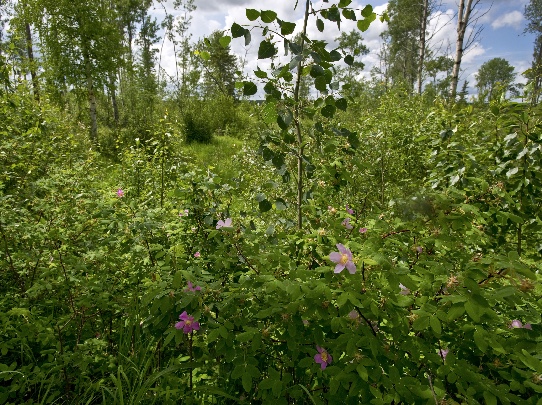
Photo: Al-Pac