Section 2.2
Linear Footprint
3.17 km/km2is the density of linear features in the Al-Pac FMA area.
The densities of specific types of linear feature include:
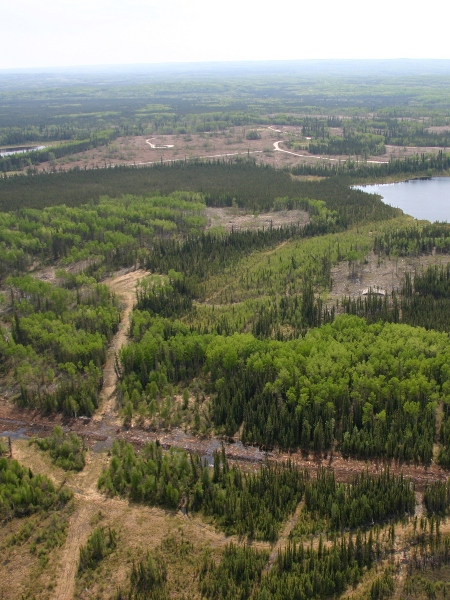
Seismic lines: 2.17 km/km2
Photo: Pembina Institute
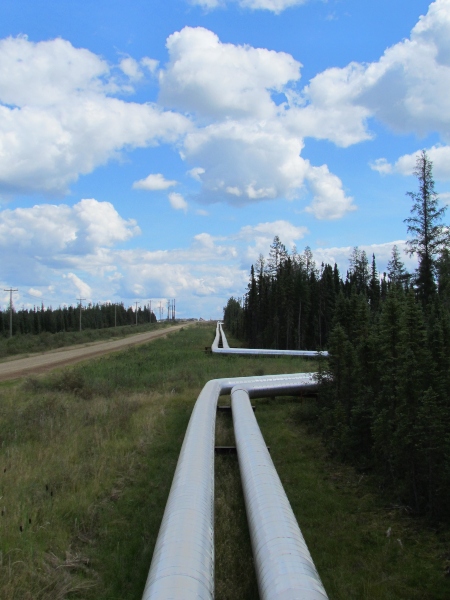
Pipelines: 0.25 km/km2
Photo: ABMI
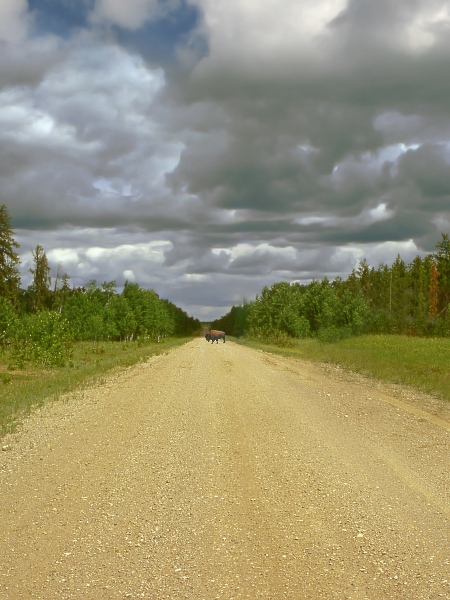
Roads: 0.15 km/km2
Photo: ABMI
Introduction
Linear footprint (e.g. seismic lines, pipelines, and roads), while occupying a small percentage area of the landbase, can have disproportionate impacts on biodiversity relative to its size[1]. Seismic lines are of particular management concern because this is the most common linear feature in northeastern Alberta. Impacts to different components of biodiversity vary by line type, width of line, as well as line density, and differ among species with some "winners" and some "losers"[2]. For example, seismic lines can:
- increase movement rates by large predators such as wolves[3];
- improve habitat suitability for some species and decrease suitability for others[4];
- facilitate dispersal of vascular plants, including non-native species[4];
- facilitate range expansion of some species like White-tailed Deer[5];
- alter predator-prey dynamics, most notably between Woodland Caribou, alternate prey (e.g., Moose, Deer), and Gray Wolves[2], and;
- alter community composition (e.g., soil mites)[6].
Understanding the distribution of linear features, including line type, is important to support cumulative effects management in the Al-Pac FMA area.
Principle 6: Environmental Values and Impacts
Criterion 6.1 – Identifying potential impacts of management activities on identified environmental values
ABMI data and reporting broadly support FSC Indicator 6.1.1(3) by providing ‘best available information’ on the distribution and density of linear features, including road networks, with maps and quantitative summaries for the Al-Pac FMA and AEI.
Criterion 6.2 – Identifying potential impacts of management activities on identified environmental values
Criterion 6.8 – Managing the landscape in the management unit to maintain and/or restore landscape values
Tracking changes in human footprint can help inform FSC Indicators 6.2.1 and 6.8.5, by showing the spatial distribution of human disturbances on the landscape. This includes tracking the density of linear features, such as roads and seismic lines.
Results
Total linear footprint density was found to be:
 Al-PAC FMA AREA: 3.17 km/km^2
Highlights
- Seismic lines are the predominant line type in the Al-Pac FMA area, representing 87% of the total length of all lines at the FMA scale. Density of conventional and low impact seismic lines are 1.75 km/km2 and 1.00 km/km2, respectively.
- Pipelines and roads (minor and major) each represent between 4.6% to 7.8% of line types in the FMA area, with densities ranging from 0.15 km/km2 up to 0.25 km/km2.
- Transmission lines and railway lines have very low densities across the assessment area.
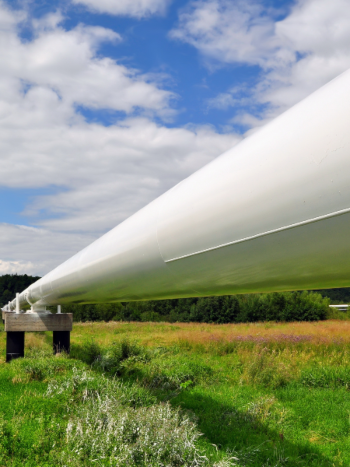
Pipeline
Photo: ABMI
References
Brook. B.W., Sodhi, N.S., and C.J.A. Bradshaw. 2008. Synergies among extinction drivers under global change. Trends in Ecology and Evolution 23(8):453-460.
Fisher, J.T. and A.C. Burton. 2018. Wildlife winners and losers in an oil sands landscape. Frontiers in Ecology and the Environment 16(6):323-328. doi:10.1002/fee.1807
Dickie, M. R. Serrouya, R.S. McNay, and S. Boutin. 2017. Faster and farther: wolf movement on linear features and implications for hunting behaviour. Journal of Applied Ecology 54(1):253-263.
Bayne, E., H. Lankau and J. Tigner. 2011. Ecologically-based criteria to assess the impact and recovery of seismic lines: The importance of width, regeneration, and seismic density. Report No. 192. Edmonton, AB. 98 p.
Dawe, K.L., E.M. Bayne, and S. Boutin. 2014. Influence of climate and human land use on the distribution of white-tailed deer (Odocoileus virginianus) in the western boreal forest. Canadian Journal of Zoology 92(4):353-363.
Meehan, M.L., Z. Son, L.M. Lumley, T.P. Cobb, and H. Proctor. 2019. Soil mites as bioindicators of disturbance in the boreal forest in northern Alberta, Canada: Testing taxonomic sufficiency at multiple taxonomic levels. Ecological Indicators 102(2019):349-365. doi.org/10.1016/j.ecolind.2019.02.043

Major road
Photo: ABMI