Section 3.1
Status of Overall Biodiversity
Pileated Woodpecker
94.6% intact on average
The ABMI's Biodiversity Intactness Index for all species in the Al-Pac FMA area is 94.6%.
The index declines as suitable habitat for each species is decreased or increased by human footprint compared to the same area without any human footprint.
 Introduction
Overall biodiversity intactness is summarized for the Al-Pac FMA area and AEI.
Principle 8: Monitoring and Assessment
Criterion 8.2 – Monitoring and evaluating environmental and social impacts of activities carried out in the management unit
FSC Indicator 8.2.3 (3) is supported by providing up-to-date ‘best available information’ on the status of naturally occurring native species from six taxa and overall biodiversity, which can inform on the effectiveness of conservation and restoration actions taken within the FMA area over time (linked to FSC Criterion 6.6).
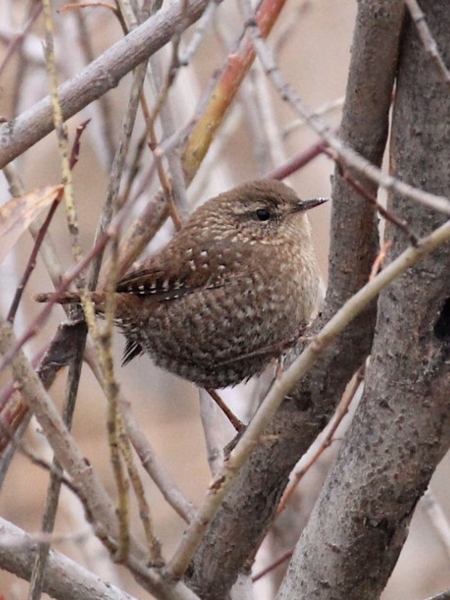
Winter Wren (Troglodytes hiemalis)
Photo: Vitalii Khustochka

Red Fox (Vulpes vulpes)
Photo: David Ellis
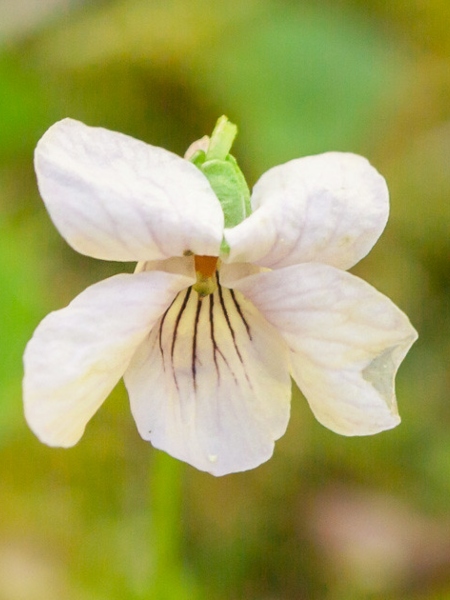
Kidney Violet (Viola renifolia)
Photo: Cindy Kilpatrick
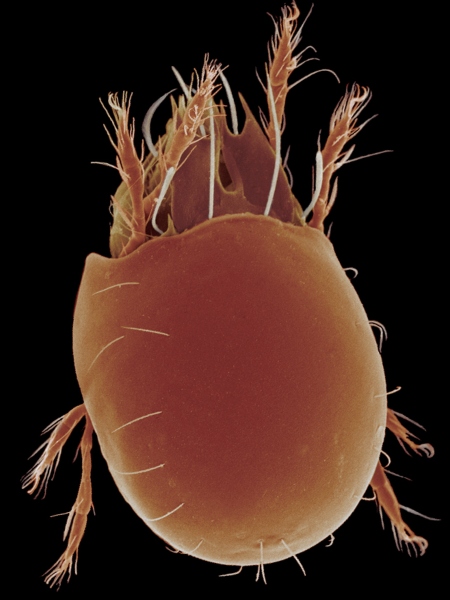
Oribatella jacoti
Photo: David Evans Walter
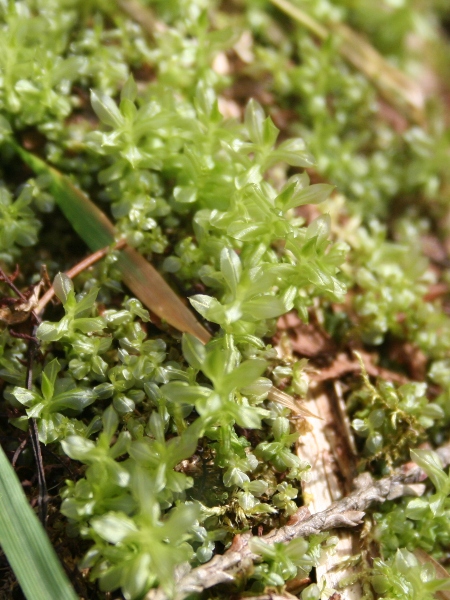
Alpine Thyme-moss (Plagiomnium medium)
Photo: Diane Haughland
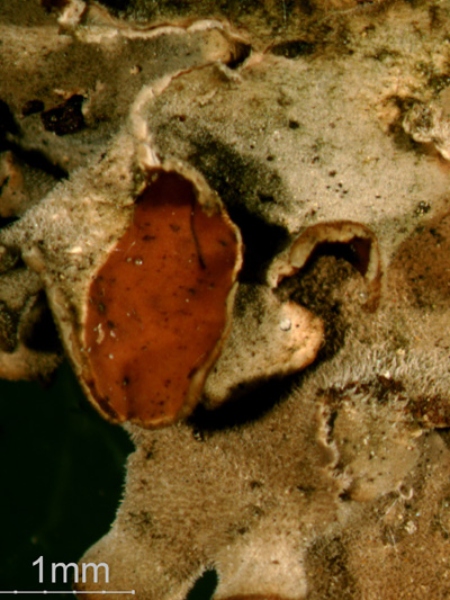
Blister Paw
(Nephroma resupinatum)
Photo: Diane Haughland
 Results
The ABMI assessed the status of 684 common native species in the Al-Pac FMA area and AEI using the Biodiversity Intactness Index and found them to be:
Highlights
- Intactness levels for taxonomic groups in the Al-Pac FMA area were similar, ranging from 93.8% intact for lichens to 96.6% for mammals. Intactness of vascular plants is relatively low mainly due to a higher proportion of species in this group that increase greatly in human footprint. Most large mammals monitored by cameras are habitat generalists that use both native habitat and human footprint resulting in higher intactness.
- Much of the Al-Pac FMA area has little to no human footprint, and correspondingly higher biodiversity intactness. Intactness is higher than the percentage of remaining native habitat (91.5%), because some species in each taxonomic group are tolerant of footprint. Overall intactness drops about 6-7% for every 10% increase in footprint. Intactness can drop at a greater rate when the amount of footprint is low in a region, because footprint creates habitat for species that prefer disturbances and would be at very low abundances otherwise. The large percent increases produce very low intactness values for these species, which lowers overall intactness.
- With the exception of vascular plants, habitat suitability for the majority of species in each taxonomic group was lower than expected compared to intact reference conditions; habitat suitability was reduced for 92% of lichen and 86% of moss species. There may be more decreaser species (species that decline in response to footprint) in these two groups because many of these species are most abundant in older forest, which is more affected by forestry footprint.
- For vascular plants and birds, deviation from intact reference conditions was also due to a number of “strong increaser” species; habitat suitability for these species was higher than expected compared to reference conditions. These are species that benefit from human footprint and are otherwise relatively uncommon in native vegetation.
- All groups except mammals had some “strong decreaser” species with disproportionately low intactness—the drop in intactness from 100% was greater than the percentage of human footprint in the region. Many of these species are associated with older deciduous and mixedwood forests that have above-average levels of human footprint.
- Intactness was higher in the Al-Pac FMA area than in the AEI, mainly due to the presence of agriculture footprint, and to a lesser extent, oil sands mines where surface mining of bitumen occurs, in the AEI.
These results have benefited from collaboration between the ABMI and various partners and contributors. More details are available in Collaborators and Contributors.
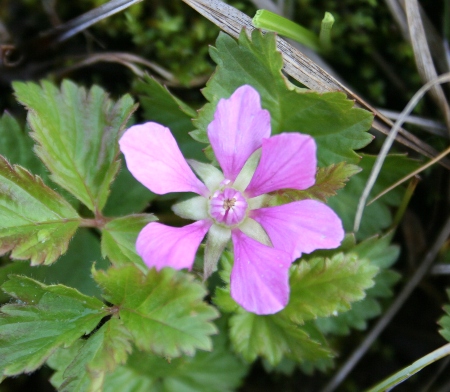
Dwarf Raspberry (Rubus arcticus)
Photo: Diane Haughland
Intactness declined by 0.8% in the FMA area, and 0.6% in the AEI due to predicted effects of human footprint on habitat suitability for species between 2010 and 2016.
References
ABMI. 2017. ABMI Essentials: Intactness. Available at: https://abmi.ca/home/publications/451-500/496
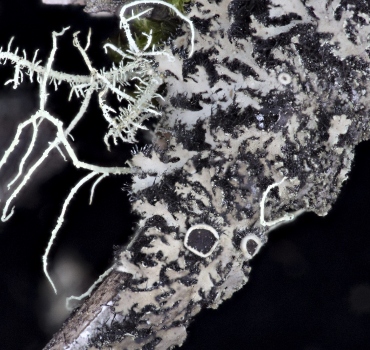
Gritty whiskered Shadow (Phaeophyscia kairamoi)
Photo: Darcie Thauvette


