Section 2.1
Human Footprint
8.5%Total Human Footprint
5.5%Forestry Footprint
As of 2017, total human footprint in the Al-Pac FMA area was 8.5%. Effective human footprint was 7.0% when recovery of forestry footprint is considered. Other results of note:
- Effective forestry footprint: 4.0%
- Trend (1999-2017): 4.8 percentage point increase (3.7% to 8.5%)
- Energy footprint: 2.1%
- Other footprint types: 0.9%

Introduction
The conversion of natural landscapes to ones dominated by human land use is the greatest threat to biodiversity[1]. Measuring human land uses—such as forest harvest areas, well pads, roads, and urban areas—is increasingly being used as a land use planning tool to monitor the status of landscapes[2]. In the Al-Pac FMA area, habitat is being modified by humans primarily as a result of activities associated with the forest industry and energy industry. Responsible development of this region depends on understanding the complex interactions between human footprint, species, and habitat.
Human footprint data, including footprint type, amount, and trend, provide the context for interpreting the change in biodiversity over time.
Principle 6: Environmental Values and Impacts
Criterion 6.2 – Identifying potential impacts of management activities on identified environmental values
Criterion 6.8 – Managing the landscape in the management unit to maintain and/or restore landscape values
Tracking changes in human footprint can help inform FSC Indicators 6.2.1 and 6.8.5, by showing the spatial distribution of human disturbances on the landscape. This includes tracking the density of linear features, such as roads and seismic lines.
Results
Total human footprint was found to be:
 FMA AREA: 8.5%
 AEI: 12.2%
2019 Highlights
- Covering 5.5% of the Al-Pac FMA area, forestry footprint was the largest human footprint type, more than double that of energy footprint, which covered 2.1%. The remaining categories of human footprint covered < 1.0% of the FMA area.
- Harvest areas represent a range of ages depending on year of harvest. The recovery of these areas partially mitigates increases from new harvesting. Effective forestry footprint is 4.0% in the Al-Pac FMA area, and 2.8% in the AEI.
- Energy footprint is similar at both scales of analysis, covering 2.1% and 2.0% of the FMA area and AEI, respectively.
- Transportation footprint also occupies similar areas at each scale of analysis, covering 0.5% and 0.7% of the FMA area and AEI, respectively.
- Agriculture footprint, at 4.7%, is the main human footprint in the AEI, but this footprint is essentially absent in the FMA area, which consists of public land and is therefore not subject to agricultural production.
- Each footprint category has distinct effects on biodiversity, as detailed in the Sector Effects sections.
ABMI human footprint data benefit from a longstanding partnership with the Government of Alberta / Alberta Environment and Parks (AEP) through the Alberta Human Footprint Monitoring Program (AHFMP). More details are available in Collaborators and Contributors.
Trend in Human Footprint
Trend Results: 1999-2017
- The total amount of human footprint in the Al-Pac FMA area increased by 4.8 percentage points between 1999 and 2017, from 3.7% to 8.5%. This is compared to a 4.0 percentage point increase in the AEI, from 8.2% to 12.2%.
- The increase was largely driven by forestry footprint, which grew by 3.5 percentage points (2.0% to 5.5%). However, this increase in forestry footprint is lower when forest recovery is considered; forestry footprint increased by 2.1 percentage points (1.9% to 4.0%) when recovery of regenerating forest is included.
- All other footprint types showed small increases (i.e., < 1 percentage points between 1999-2017), the increase in energy footprint being the largest, from 1.2% to 2.1%.
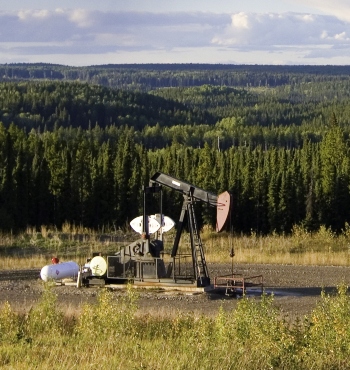
Energy footprint
Photo: Jason Kasumovic
References
Sanderson, W.W. M. Jaiteh, M.A. levy, K.H. Redford, A.V. Wannebo, and G. Wolmer. 2002. The human footprint and the last of the wild. Bioscience 52(10):891-904.
Haines, A.M., M. Leu, L.K. Svancara, J.M. Scott, and K.P. Reese. 2008. A theoretical approach to using human footprint data to assess landscape level conservation efforts. Conservation Letters 1:165-172.
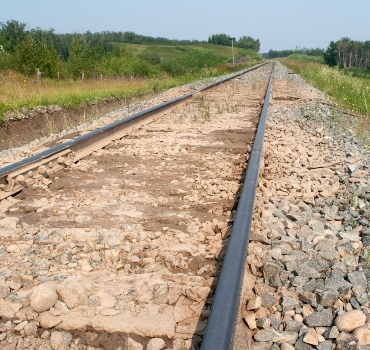
Transportation footprint
Photo: ABMI