Section 1.4
Methods
154 sitessurveyed in the Al-Pac FMA area, out of a total of 157 sites, and 323 out of 355 sites in the Area of Ecological Interest (AEI).
The ABMI monitors the state of Alberta’s land cover and biodiversity, including in Al-Pac's FMA area and surrounding AEI.

Introduction
From the boreal forest in the north to the grasslands in the south, the ABMI monitors the state of Alberta’s biodiversity. To do this, the ABMI employs a systematic grid of 1,656 site locations, spaced 20 km apart, to collect biodiversity information, including species and habitat data, at both terrestrial and wetland sites[1]. The ABMI also monitors at additional 'targeted' sites as needed to address additional monitoring and research objectives.
At each location, ABMI technicians record the species that are present, and measure a variety of habitat characteristics. For species that cannot be identified in the field (e.g., mites and lichen), ABMI taxonomists located at the Royal Alberta Museum sort, identify, and archive samples to complete the Institute’s species-level dataset. Through our field and laboratory efforts, the ABMI has detected over 3,000 species in Alberta.
In the Al-Pac FMA area, the ABMI has collected monitoring data at 154 out of 157 sites. In the AEI, the ABMI has collected monitoring data at 323 out of 355 sites.
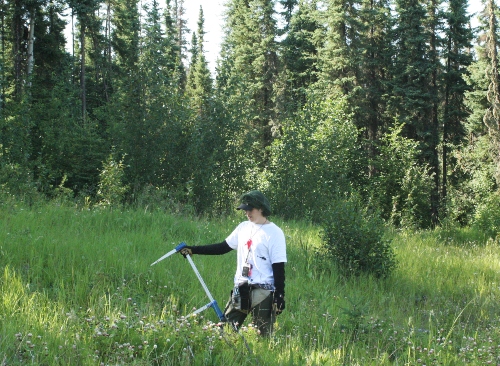
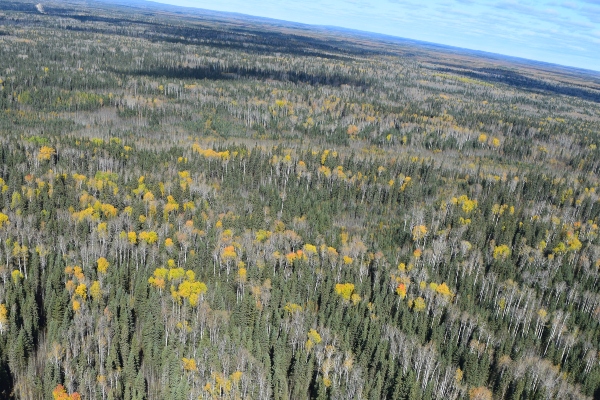
Photo: ABMI
Methods
Click on a tab to review a summary of methods and analysis for human footprint, linear features, interior native habitat, biodiversity intactness, and sector effects.
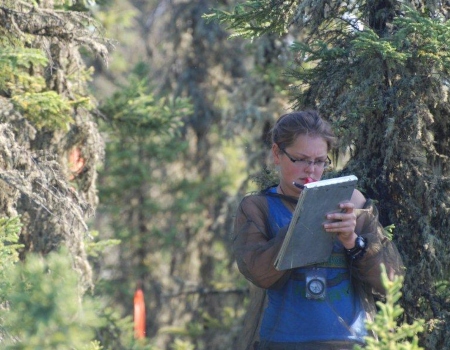
Photo: ABMI
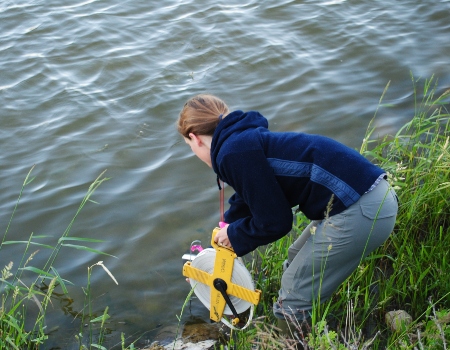
Photo: ABMI
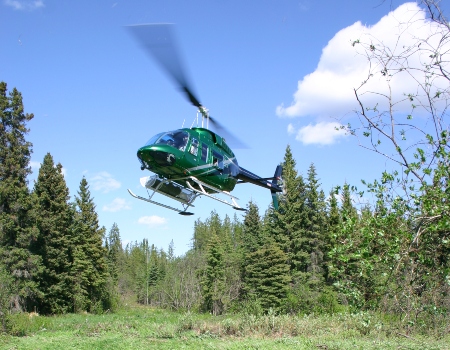
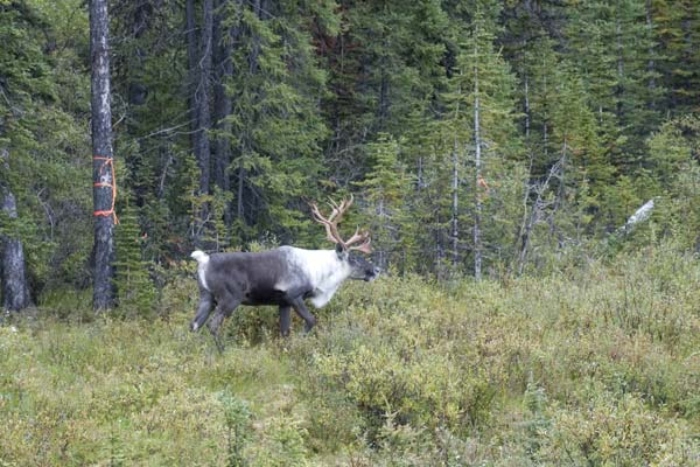
Photo: Chris Koloczan
Human Footprint
The ABMI defines human footprint as the visible alteration or conversion of native ecosystems to temporary or permanent residential, recreational, agricultural, or industrial landscapes. The definition includes all areas under human use that have lost their natural cover for extended periods of time, such as cities, roads, agricultural fields, and surface mines. It also includes land that is periodically reset to earlier successional conditions by industrial activities such as forest harvest areas and seismic lines. Some human land uses, such as grazing, hunting, and trapping, or the effects of pollution, are not yet accounted for in our human footprint analyses.
ABMI human footprint data benefit from a longstanding partnership with the Government of Alberta / Alberta Environment and Parks (AEP) through the Alberta Human Footprint Monitoring Program (AHFMP). More details are available in Collaborators and Contributors.
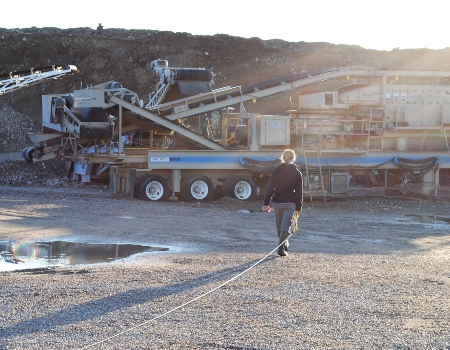
Photo: ABMI
Human Footprint Categories
Human footprint is divided into six categories for analysis:

Agriculture Footprint
Areas of annual or perennial cultivation, including crops and tame pasture, as well as confined feeding operations and other high-density livestock areas.

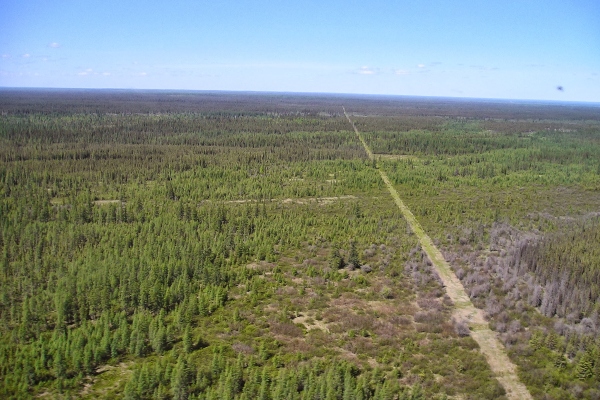
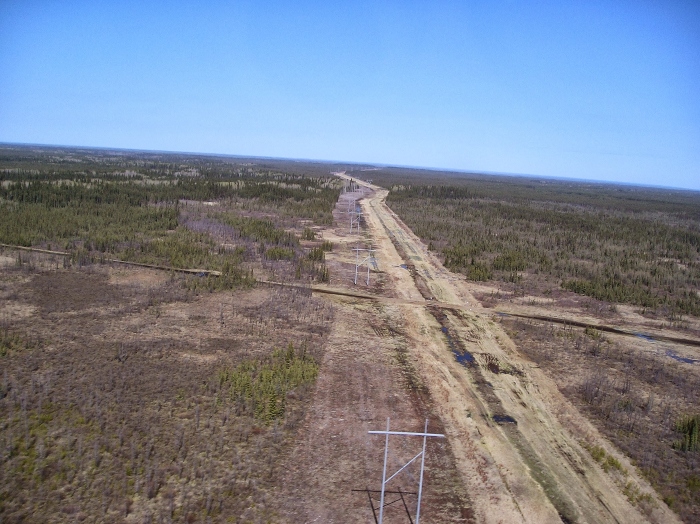
Energy Footprint
Areas where vegetation or soil has been disturbed by the creation of mine sites, peat mines, pipelines, seismic lines, transmission lines, well sites, and wind-generation facilities. This footprint type is called “energy footprint” because most of this footprint type is associated with the energy industry.

Forestry Footprint
Areas in forested landscapes where timber resource extraction has occurred for industrial purposes, including clear-cut and partial-cut logging methods.
![]()
Effective Forestry Footprint
The area of forestry footprint pro-rated for how much it has recovered for biodiversity, based on harvest area age and stand type (deciduous or conifer). A newly harvested area is considered to be 0% recovered, while mature forest is 100% recovered.

Human-created Waterbodies
Human-made waterbodies created for a variety of purposes, such as to extract fill (borrow pits, sumps), water livestock (dugouts), transport water (canals), meet municipal needs (water supply and sewage), and store water (reservoirs).
![]()
Transportation Footprint
Railways, roadways and trails with hard surfaces such as cement, asphalt, or gravel, roads or trails without gravel or pavement, and the vegetation strips alongside transportation features.

Urban/Industrial Footprint
Combines urban, rural, and industrial footprint types including residences, buildings, and disturbed vegetation and substrate associated with urban and rural settlements, such as housing, shopping centres, industrial areas, golf courses, and recreation areas, as well as bare ground cleared for industrial and commercial development.

Total Human Footprint
Summary of six human footprint categories combined, including: agriculture, energy, forestry, human-created waterbodies, transportation, and urban/industrial.
![]()
Effective Human Footprint
Same definition as Total Human Footprint but replacing Forestry Footprint with Effective Forestry Footprint.
How Human Footprint is Analyzed & Reported
The ABMI monitors the status of Alberta’s human footprint using satellite imagery at two spatial scales:
3 × 7 -km Samples
The ABMI uses human footprint data measured annually at a 1:5,000 scale to track changes in human footprint over time. Detailed annual samples of human footprint are measured in a 3 × 7-km rectangular area centred near each of the ABMI’s 1,656 sites, which when summed across all sites amounts to about 5% of the province’s land surface. ABMI human footprint trend data are available from 1999 to 2017, except for 2000 - 2003 (inclusive). Trend data and the metadata associated with these data can be accessed here.
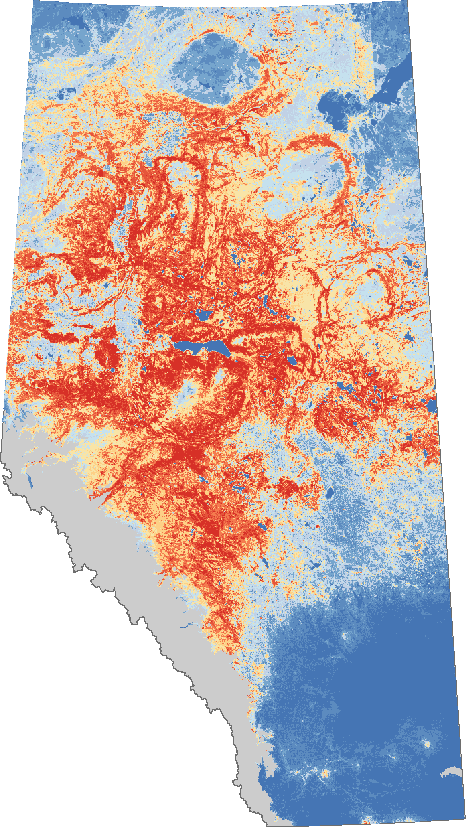
Provincial Scale
At the provincial scale, the ABMI merges 20 human footprint sub-layers (based on 117 feature types) into a single integrated layer by applying a specific order of precedence to create the ABMI Human Footprint Inventory (HFI), circa 2017. Some of these 20 sub-layers are created by the ABMI and Government of Alberta (Alberta Environment and Parks) as part of the Alberta Human Footprint Monitoring Program (more details of this partnership are available in Collaborators and Contributors). We use the HFI 2017 for two purposes in this report: to generate maps of human footprint in the Al-Pac FMA area and AEI, and to standardize the 3 × 7-km trend estimates before reporting. This product is updated approximately every two years; these data and the metadata associated with this product are available here.
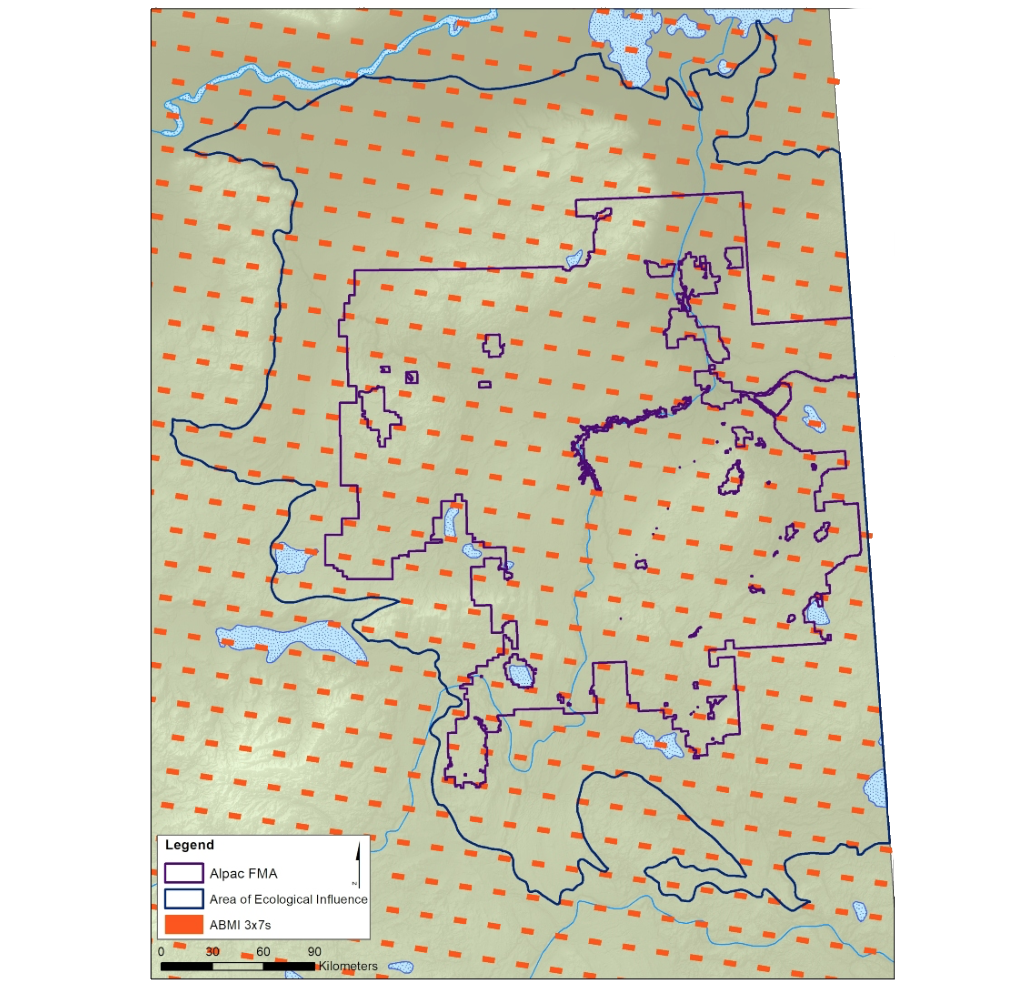
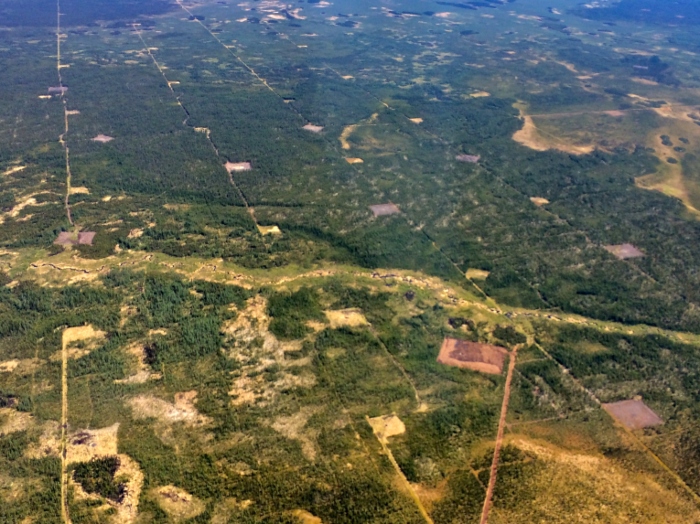
Figure: A detailed inventory of human footprint is created annually for a 3 × 7 km area located near each ABMI site.
Recovery of Human Footprint
As a successional footprint, forestry recovers with time after disturbance. To account for this recovery, we summarize “recovered forestry”—defined as Effective Forestry Footprint Area in this report—prorating the effects on biodiversity of older harvested areas using biotic recovery curves based on a literature review[2]. Biodiversity recovery values for forestry are based on a review of the recovery of forest species in harvest areas of different ages[2]. A newly harvested area is considered to be 0% recovered, while mature forest is 100% recovered. Field studies of the abundance of a variety of species in harvest areas of different ages were used to fill in the recovery curve between those two benchmarks. The results showed faster recovery in deciduous forest than in conifer forest, so we have different recovery curves for those two forest types. We do not yet have information on recovery of other types of human footprint.
| Stand Type | Age class (yr) | Biodiversity Recovery (%) | EHFA Factor (%) |
| Deciduous | 0-9 | 0.0 | 100.0 |
| 10-19 | 36.8 | 63.2 | |
| 20-39 | 58.2 | 41.8 | |
| 40-59 | 83.1 | 16.9 | |
| 60-79 | 93.2 | 6.8 | |
| 80+ | 100.0 | 0.0 | |
| Coniferous | 0-9 | 0.0 | 100.0 |
| 10-19 | 8.0 | 92.0 | |
| 20-39 | 24.8 | 75.2 | |
| 40-59 | 64.7 | 35.3 | |
| 60-79 | 83.9 | 16.1 | |
| 80+ | 100.0 | 0.0 |
We report on Effective Human Footprint Area (EHFA) for biodiversity by pro-rating the area of a harvest area for how much it has recovered, based on its age and stand type (deciduous or conifer). For example, a 10-ha harvest area that is at an age where it is 36.8% recovered would have an EHFA of 6.32 ha (=10ha * (100-36.8%)). The idea is that the harvest area would have biodiversity equivalent to 6.32 ha of recent, unrecovered clearcut plus 3.68 ha of mature forest.
To do the calculation, we use GIS to summarize the area of each harvest area, its age (years since it was harvested) and stand type (deciduous or conifer). We group the ages into classes of 0-9 yr, 10-19 yr, 20-39 yr, 40-59 yr, 60-79 yr, and 80+ yr. Based on the age class and stand type, we multiply the area of each harvest unit by the EHFA factor in the table below, to give the EHFA of that unit.
Members of the University of Calgary's Applied Geospatial Research Group contribute to the ongoing research around footprint recovery. More details are available in Collaborators and Contributors.
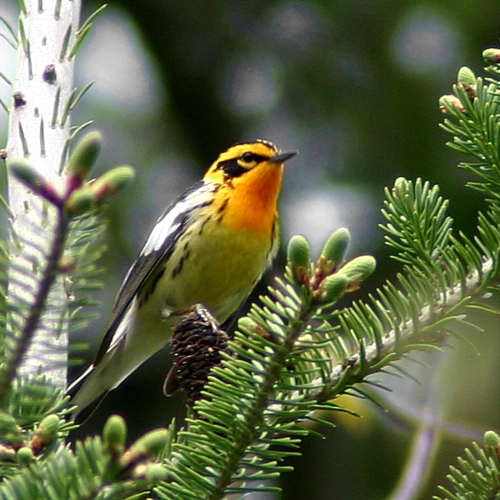
Blackburnian Warbler (Setophaga fusca)
Photo: Chris Koloczan
Reporting on Human Footprint
To report on the status of human footprint, the ABMI presents the percentage of land directly altered by human activities, ranging from 0% (no visible human footprint) to 100% (completely modified by human footprint).
In general, cities and cultivated fields have high human footprint, while protected and undeveloped areas have low human footprint. Human footprint is summarized for total human footprint and by the six reporting categories.
Trend in human footprint in the Al-Pac FMA area was assessed using the 3 × 7 km detailed inventory of human footprint available from 1999 to 2017, except for 2000-2003. Trend is presented for total human footprint, effective human footprint and by the seven reporting categories. For forestry footprint and total human footprint (both status and trend), we also report on the area of their respective footprints after reducing the area of older forestry footprint based on how recovered it is, referred to as Effective Forestry Footprint and Effective Human Footprint.
The maps used to visualize human footprint in this report are based on the GIS Inventory of Provincial Human Footprint, circa 2017.


Our Data Partners
We are thankful to the many organizations and institutions that contribute information to the ABMI, supporting analyses and results found in this report and elsewhere. These partnerships make the ABMI, and its data and information products, stronger.
For this report, we particularly acknowledge the contributions of the Boreal Avian Modelling Project, Environment and Climate Change Canada, members of the Applied Geospatial Research Group at the University of Calgary, the Caribou Monitoring Unit, the Bioacoustic Unit, and Alberta Environment and Parks.
More information on our data partners is given on the Collaborators and Contributors page.
ABMI Data
References
A more detailed overview of the methods used to produce the ABMI's species-habitat models and Intactness Index is available on the main ABMI website.
Additionally, the following resources were referenced in this report:
Alberta Biodiversity Monitoring Institute. 2014. Terrestrial field data collection protocols (abridged version) 2018-05-07. Alberta Biodiversity Monitoring Institute, Alberta, Canada. Report available at: abmi.ca.
Huggard, D. and L. Kremsater. 2015. Human footprint recovery for the Biodiversity Monitoring Framework - Quantitative Synthesis. Unpublished Report.
Huggard, D. and L. Kremsater. 2015. Recommendations for forest interior and old-forest indicators for the Biodiversity Management Framework. Unpublished Report.
Azeria, E.R., P. Sólymos, D.J. Huggard, M-C. Roy, and J. Schieck. 2019. Detail methods and results for predicting species status and relationships. Technical Report available at: https://abmi10years.ca/10-year-review/resources/.
Sólymos, P. and J. Schieck. 2016. Effects of industrial sectors on species abundance in Alberta. ABMI Science Letters, Issue 5: October, 2016.
ABMI remote crew
Photo: ABMI